The Observational Method for Tailings Dams: Risk-Informed by Design
Karl Terzaghi and Ralph Peck proposed the observational method because soil doesn't read textbooks. Decades later, combined with continuous monitoring and AI-assisted analysis, it becomes the backbone of risk-informed TSF design — and of compliance with GISTM.
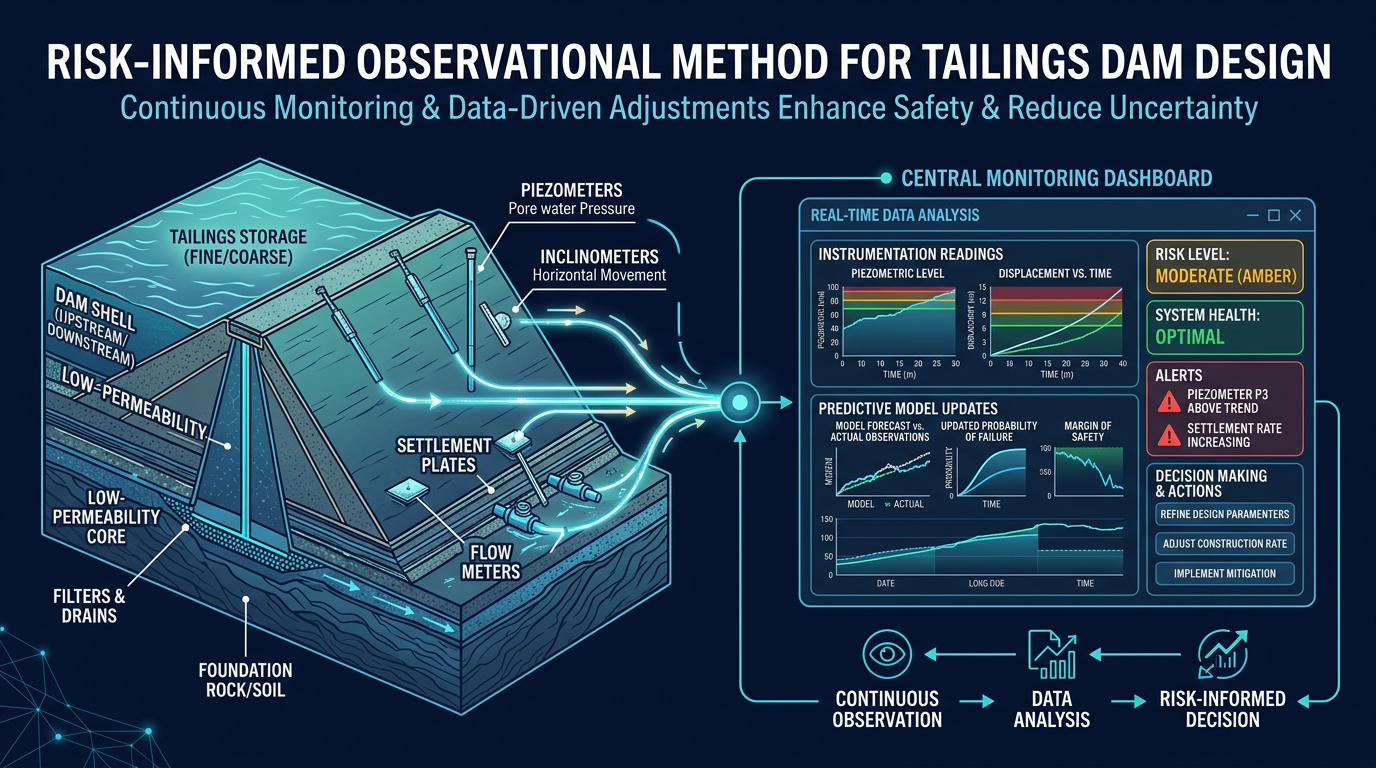
The short version of Peck's idea
The observational method says: design is a hypothesis, and the structure is the experiment. You define the most probable behaviour, a set of less probable but still credible behaviours, and a contingency plan for each. As construction and operation proceed, you observe how the soil and the structure actually behave — and you update the design accordingly.
It's a method built for structures whose parameters are genuinely uncertain at design time. Tailings dams are exactly that.
Why it keeps being re-invented
The method gets rediscovered every time the industry learns a hard lesson. After each major tailings incident, the post-mortems point to the same gap: the design was treated as a fixed artifact, not a hypothesis to be continuously tested. Monitoring existed but wasn't tied back to the design envelope. Deviations existed but weren't treated as signals. People saw the numbers but nobody updated the hypothesis.
GISTM anchor: Principles 3–8 essentially formalize observational thinking: knowledge base, risk assessment, credible failure modes, continuous risk management and emergency preparedness are all variations of "keep observing, keep updating, keep being honest about uncertainty".
Four ingredients of a modern observational program
- Explicit design envelopes. Each critical parameter (phreatic surface, pore pressure, settlement, crest displacement) has a green-amber-red band derived from the design. Not a single threshold — a band with expected trajectory over time.
- Continuous instrumentation. Piezometers, inclinometers, settlement plates, InSAR, satellite imagery, drone photogrammetry — layered so no single instrument is a single point of failure.
- A signal discipline. Every reading goes into a pipeline that flags drift (sustained trend toward a band edge) and deviation (band exceedance). The EoR is paged on deviation, not on drift — but drift still gets logged and trended.
- Decision cadence. The design hypothesis is revisited on a fixed cadence (quarterly for active facilities) and re-endorsed, tuned, or replaced. The ITRB has visibility into those revisions.
Where AI genuinely helps (and where it lies)
AI and data agents — including our water-balance agent and GISTM.ai — shine when asked to:
- Ingest monitoring streams and flag drift faster than humans can eyeball the charts.
- Correlate anomalies across instruments (e.g., piezometer rise + crest displacement + rainfall).
- Assemble the evidence package the EoR needs for a decision — instead of the EoR spending two days chasing data owners.
AI gets dangerous when it is asked to predict safety. A dashboard that says "dam safe: 98.4%" is an illusion. Safety is not a regression score — it's the absence of credible failure modes given the evidence. The observational method resists this temptation structurally: it forces the human to state the hypothesis, and AI merely pressure-tests it.
How we implement this with clients
For operators embracing GISTM, the observational method becomes a concrete governance deliverable. Our typical package:
- Codify design envelopes into a KPI tree and a Health Index.
- Wire monitoring systems to the Health Index via GISTM.ai's data agents.
- Establish drift/deviation protocols and escalation rules — who gets paged, by whom, with what evidence attached.
- Set the ITRB's cadence of review over the evolving design hypothesis, not just over the original design document.